
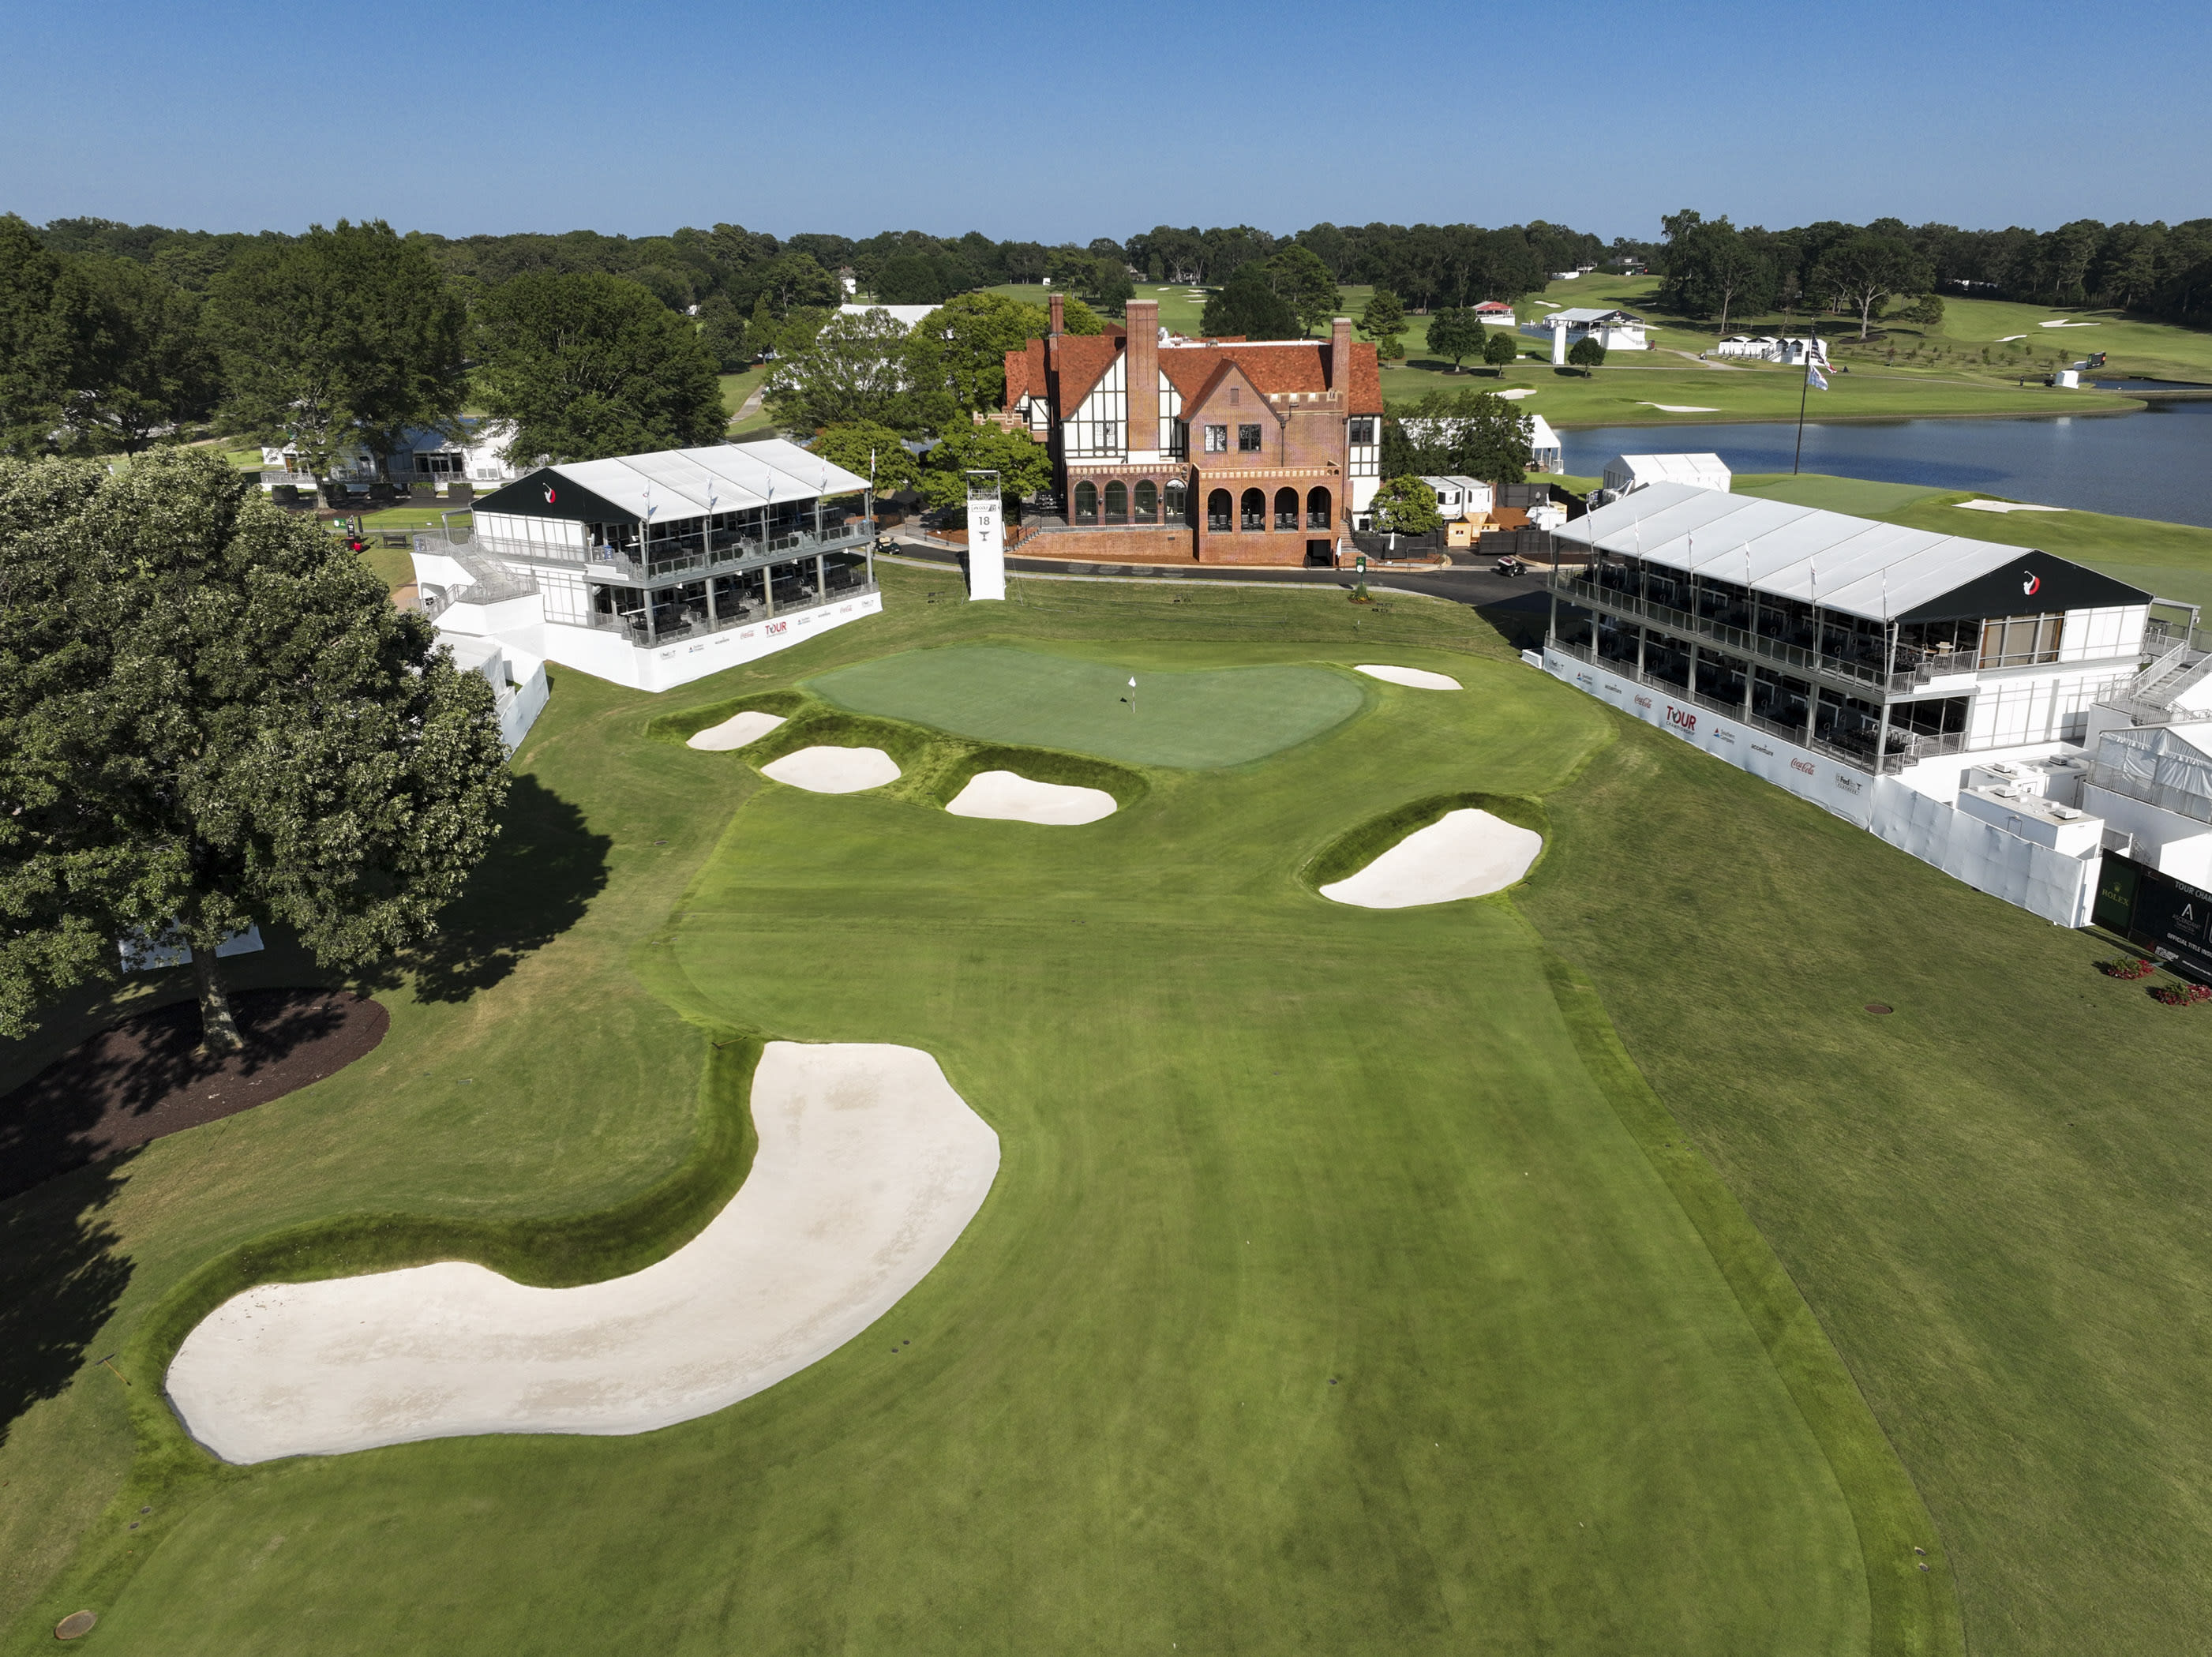
The Card
- Venue: East Lake Golf Club
- Where: Atlanta, Georgia, USA
- Architect: Tom Bendelow
- Scorecard: Par 70, 7,440 yards
- Fairways: Zoysia
- Rough: Bermuda, 3.5 inches
- Greens: Bermuda, running 12 on the stimp
What Kind Of Test This Is
East Lake reads as a hard-looking card that gives up plenty of birdies. The scoring markers all sit at the soft end of the tour range: a bogey-or-worse rate of 12.6% ranks 173rd hardest of 191 courses, birdie-or-better at 26.1% ranks 176th, and scrambling at 64.6% also ranks 176th. Players got up and down here more freely than they do almost anywhere else on record.
The putting numbers are the extreme entry. Conversion from inside 10 feet was 90.5%, which rates as the single easiest mark of the 191 courses measured, and from outside 10 feet 20.2% ranks 177th. Greens rolling 12 that also hold their line take a category of mistake off the table for a 30-man field.
Where the course does bite is off the line. The penalty for missing the fairway, 0.40, ranks 55th hardest, driven by 3.5 inches of bermuda rough, while the penalty for missing the green (0.74) and greens in regulation (68.4%) both sit around tour average. Lack of distance cost very little, ranking 152nd.
One caveat matters more than any of the individual figures: this profile is averaged over 2025 and covers a single running of the event. Treat it as indicative rather than settled.
The read: Price this as a birdie-fest with a rough penalty attached, not as a par-70 grind.
The Holes
The card is 4 par 3s, 12 par 4s and 2 par 5s, with the par 3s averaging a stout 226 yards and the par 4s 452. The par 4s stretch from 390 to 530 yards, and seven of them measure between 360 and 450, so the mid-length two-shotters are where the bulk of the round is played.
The pain is concentrated in the long par 4s. Hole 1 (510 yards) played 0.138 over par, hole 14 (530 yards) 0.130 over, and hole 4 (465 yards) 0.097 over. None of those is brutal in absolute terms, which is consistent with the low bogey rate, but they are the holes where a field this small can quietly lose ground.
The two par 5s are the scoring engine. Hole 6 at 525 yards played 0.478 under par and hole 18 at 585 yards 0.410 under, with hole 3 (415 yards, 0.165 under) the only other clear giveaway. With just two par 5s on the card, converting both is close to mandatory.
The read: Backers of long hitters get their edge on 6 and 18 and need survival on 1, 4 and 14.
Where Strokes Are Won And Lost
The strongest signal in the brief is a wedge-and-mid-iron one. Proximity from 150 to 175 yards, measured on recent form, tracked scoring at 0.278 here against 0.056 tour-wide, a gap of +0.223. Proximity from 100 to 125 yards added a gap of +0.106, and greens in regulation +0.11. Proximity from 125 to 150 yards went the other way at -0.104, so this is not a blanket approach read, it is specific to the yardages either side of that band.
Off the tee, both markers lean positive. Adjusted off-the-tee strokes gained tracked scoring 0.102 more closely than at a typical event, and adjusted driving distance 0.106 more. Combined with tee-to-green total at a gap of +0.137, the tee-to-green half of the game carried more weight here than it does at an average stop.
The short game and the flat stick move the other way, and that is a finding rather than a hole in the data. Scrambling posted a gap of -0.173, 3-putt avoidance -0.156, adjusted putts gained -0.137, around-the-green strokes gained -0.105 and putting from 5 to 10 feet -0.093. When almost everyone makes everything inside 10 feet and gets up and down two times in three, those skills stop separating the field.
The counter-argument is sample. These gaps are averaged over seven runnings of roughly 29 players each, which is a thin base by any standard, and correlations describe what travelled with a good week rather than what the course extracts. The direction is consistent across related metrics, which helps, but the magnitudes should be held loosely.
The read: Weight approach from 150 to 175 and driving over short game, and do not pay up for a putting specialist.
Courses It Resembles
The measured comps are TPC River Highlands at 88.5% similar (par 70, 6,844 yards), The Club at Chatham Hills at 88.0% (par 70, 7,273 yards), TPC Craig Ranch at 86.4% (par 71, 7,385 yards), Panther Creek Country Club at 86.2% (par 71, 7,258 yards) and PGA West Nicklaus at 85.7% (par 72, 6,924 yards).
What binds them is not the look. Most of the list plays shorter than East Lake's 7,440 yards, and the shared trait is the scoring environment: venues where the field makes birdies in volume and the separation comes from who makes the most of them rather than who avoids the fewest mistakes.
The read: Course-history models built on birdie-heavy venues such as TPC Craig Ranch and TPC River Highlands should carry weight here.
What It Took To Win
Winning scores have deepened. Patrick Cantlay took the 2021 edition at -11 and Tiger Woods the 2018 at -11, while Collin Morikawa went -22 in 2024 and Viktor Hovland -19 in 2023. Tommy Fleetwood won at -18 in 2025.
Across the champions listed, the tally of strongest categories is putting 5, off the tee 4, around the green 1 and approach 1. That sits awkwardly against the negative putting gaps above, and the tension is worth stating plainly rather than smoothing over. Fleetwood gained 2.037 putting in 2025 and Xander Schauffele 2.125 in 2020, which is what a hot week on 12-stimp bermuda looks like.
The more repeatable route is the driving one. Rory McIlroy gained 1.651 off the tee in 2016 and 1.329 in 2019, and Hovland paired 1.204 off the tee with 1.204 on approach in 2023. Putting decides who converts, but the tee-to-green work is what puts a player in position to be decided about, and it is the half of the game the gap data supports.
The read: Build around elite tee-to-green form in a 30-man field and treat a putting week as the upside, not the thesis.